X
[sort:name]
Technical Q&A
1. The purpose of the lead-breaking experiment
The acoustic emission signal generated by the breakage of pencil lead is a very typical burst acoustic emission signal, which has the characteristics of stable signal, wide spectrum, strong repeatability and easy implementation. It is a good simulated acoustic emission source and is often used for the calibration of acoustic emission sensors. Since the acoustic emission signal itself is a non-stationary signal, the useful signal contained is often interfered with. By analyzing the acoustic emission signal of broken lead, the interference signal and the useful signal are separated, and the time domain, frequency domain and other characteristics of the acoustic emission signal of broken lead are explored.
2. Lead Cutting Experiment
Use an HB pencil with a diameter of 0.5mm and a lead extension of 2.5mm. Ensure that the angle between the lead and the specimen surface is 30° each time the lead is broken, and use a magnetic clamp to fix the acoustic emission sensor. A coupling agent is applied between the WSa acoustic emission sensor (working frequency 100~1000KHz) and the specimen to reduce excessive scattering and attenuation of the acoustic emission signal at the interface between the sensor and the specimen. Use a pencil to slowly press the pencil lead at an angle of 30 degrees at a distance of 30mm from the acoustic emission sensor to break it, and collect the emitted acoustic emission signal. The main parameter settings of the AEwin acquisition system are shown in Table 2.2.

3. Lead Break Acoustic Emission Signal
1. Wavelet analysis of lead break signal
Acoustic emission signal is a typical non-stationary signal, in which various useful information is often disturbed. Wavelet transform can decompose and reconstruct the signal at different scales, and analyze the corresponding time domain waveform in different frequency bands to extract signal features. Therefore, wavelet transform is used to analyze the broken lead acoustic emission signal.
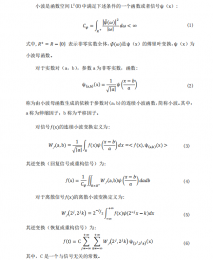
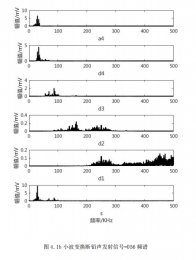
The db10 basic wavelet is used to perform four-layer wavelet decomposition and reconstruction on the collected broken lead acoustic emission signal. s is the original signal, d1, d2, d3, d4 are the detail signals of the 1st, 2nd, 3rd, and 4th layers, respectively, containing high-frequency information of each layer, and a4 is the approximate signal of the 4th layer, containing low-frequency information. The frequency ranges of the reconstructed signals of a4, d4, d3, d2, and d1 are: 0-31.25KHz, 31.25-62.5KHz, 62.5-125KHz, 125-250KHz, and 250-500KHz.
1. Lead break acoustic emission signal-056
The waveform and spectrum of the lead-breaking signal -056 collected by the acoustic emission sensor at 30mm after wavelet decomposition and reconstruction are shown in Figures 4.1, 4.2, and 4.3. From the amplitude of s (the spectrum of the original signal) in Figure 4.2, which is 240mV, it can be seen that the frequency of the lead-breaking acoustic emission signal is mainly concentrated between 10-110KHz, and the frequency peaks are 29KHz, 69KHz, and 87KHz. The waveform amplitude of the d1 signal in Figure 4.1 is 148mV, and the frequency is mainly distributed in 200-500KHz, with peak frequencies of 250KHz and 453KHz. The waveform amplitude of the d2 signal is 71mV, and the frequency is mainly distributed in 85-300KHz, with peak frequencies of 164KHz and 249KHz. The waveform amplitude of the d3 signal is 85mV, and the frequency is mainly distributed in 50-110KHz, with a peak frequency of 87KHz. The d4 signal waveform amplitude is 176mV, the frequency is mainly distributed in 22-80KHz, and the peak frequency is 33KHz. The a4 signal waveform amplitude is 228mV, the frequency is mainly distributed in 10-50KHz, and the peak frequency is 29KHz.
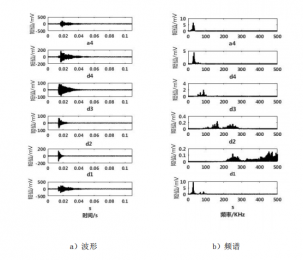
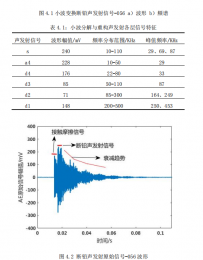
In the lead breaking experiment, contact friction occurs during the process of slowly breaking the pencil lead. Therefore, the acoustic emission signal should include the lead breaking acoustic emission signal and the contact friction signal as well as the collision between the pencil tip and the cast iron plate, as shown in Figure 4.2. The waveform amplitude of the d1 signal in Figure 4.1a is 148mV, which is smaller than the amplitude of the original signal. The corresponding spectrum amplitude of d1 in Figure 4.1b is less than 0.2mV, which may be a high-frequency contact friction signal; the waveform amplitude of the d2 signal in Figure 4.1a is 71mV, which is only one-third of the original signal amplitude. The corresponding spectrum amplitude of d2 in Figure 4.1b is also very small (0.2mV), which should be a high-frequency contact friction signal; the waveform amplitude of the d3 signal in Figure 4.1a is 85mV, which is close to one-third of the original signal amplitude. The corresponding spectrum amplitude of d3 in Figure 4.1b is larger (2mV), which should be a signal mixed with contact friction signal and lead break acoustic emission signal; the waveform amplitude of the d4 signal in Figure 4.1a is 176mV, which is close to the original signal amplitude. The corresponding spectrum amplitude of d4 in Figure 4.1b is larger (4.4mV), which should mainly contain lead break acoustic emission signals; a4 in Figure 4.1a The signal waveform amplitude is 176mV, which is close to the original signal amplitude. The corresponding spectrum amplitude of a4 in Figure 4.1b is larger (6.5mV), which should be the lead break acoustic emission signal;
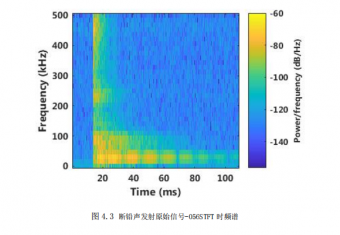
As shown in Figure 4.3, the original signal of the broken lead acoustic emission-056STFT time spectrum, it can be seen that the signal frequency is divided into three steps along the time axis. The first step is the high frequency band (200-500KHz), which mainly appears at the initial moment of the original signal. At this moment, the pencil lead has not broken, and contact friction mainly occurs. From here, it can be seen that d1 and d2 are the accuracy of the contact friction signal. The second step is 50-110KHz. From the moment the pencil lead breaks, the broken lead acoustic emission signal is mainly used. It can be seen that d4 is mainly the accuracy of the broken lead acoustic emission signal. The third step is the low frequency band of about 10-40KHz, which lasts for a long time and conforms to the attenuation process of the broken lead acoustic emission signal. It is a broken lead signal. As shown in Figure 4.3, the original signal of the broken lead acoustic emission-056STFT time spectrum, it can be seen that the signal frequency is divided into three steps along the time axis. The first step is the high frequency band (200-500KHz), which mainly appears at the initial moment of the original signal. At this moment, the pencil lead has not broken, and contact friction mainly occurs. From here, it can be seen that d1 and d2 are the accuracy of the contact friction signal. The second step is 50-110KHz, when the pencil lead breaks, the main signal is the lead-breaking AE signal. It can be seen that d4 is mainly the accuracy of the lead-breaking AE signal. The third step is the low-frequency band of about 10-40KHz, which lasts for a long time and is consistent with the attenuation process of the lead-breaking AE signal. It is the lead-breaking signal.
IV. Conclusion
The wavelet transform method is used to decompose the original signal of lead break acoustic emission into different frequency bands. The time domain waveform and spectrum correspondence analysis of different frequency bands are combined to separate the lead break acoustic emission signal from the contact friction signal, and extract the signal containing more lead break acoustic emission information, which eliminates more interference signals for further extraction of lead break acoustic emission features and can improve the accuracy of the extracted feature values.
2. Lead break acoustic emission signal-231 (to be continued)
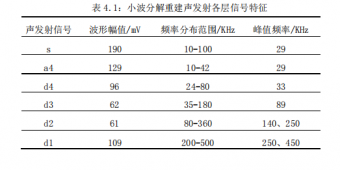
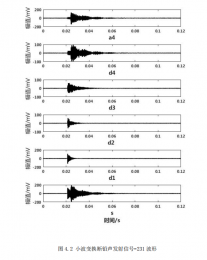
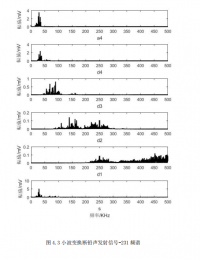
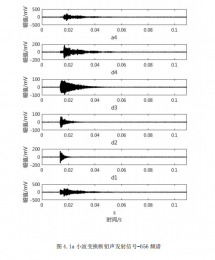
The waveform and spectrum of the lead-breaking signal collected by the acoustic emission sensor at 30mm are shown in Figures 4.1, 4.2, and 4.3 after wavelet decomposition and reconstruction. From Figure 4.2 (the spectrum of the original signal), it can be seen that the frequency of the lead-breaking acoustic emission signal is mainly concentrated between 10-100KHz, with a peak frequency of 29KHz. In Figure 4.1, the d1 signal waveform amplitude is 109mV, the frequency is mainly distributed in 200-500KHz, and the peak frequency is 250KHz and 450KHz; the d2 signal waveform amplitude is 61mV, the frequency is mainly distributed in 80-360KHz, and the peak frequency is 140KHz and 250KHz; the d3 signal waveform amplitude is 62mV, the frequency is mainly distributed in 35-180KHz, and the peak frequency is 89KHz; the d4 signal waveform amplitude is 96mV, the frequency is mainly distributed in 24-80KHz, and the peak frequency is 33KHz; the a4 signal waveform amplitude is 129mV, the frequency is mainly distributed in 10-42KHz, and the peak frequency is 29KHz.
