1 the introduction
Pipeline as an important means of transportation, such as petroleum, chemical industry and urban water supply industry plays an irreplaceable role. Pipeline, however, after long-term use, leakage accident happens often, not only cause the waste of resources, also seriously affect people's life and property safety. Urban water supply, for example, the world's big cities water supply pipe network leakage rate is in commonly 20%, some even as high as 50%. Therefore, if you can use a variety of nondestructive testing methods for effective monitoring of leakage of the pipeline in service, to reduce the leakage caused by the waste, will be able to greatly reduce global scope increasingly serious water shortage problem.
Acoustic emission technology as a dynamic nondestructive testing method, is currently the international popular, potential leakage source information of stress wave propagation along the liquid pipeline. Using fixed outside the pipe wall of the acoustic emission sensor to pick up the leakage acoustic emission signal, leakage source information can be got through signal analysis (leak location, size, etc.). Usually, assuming that the speed of the acoustic emission signal propagation along the pipeline leakage is changeless, by analysis of leakage acoustic emission signal is related to determine leakage acoustic emission signals to achieve two sensors lag, to determine the location of the leakage source. However, in most cases, the leak by is directly related to the analysis on the source to a poor effect. Because of the liquid leakage inspire stress wave signal is actually the modal frequency and guided wave signal, the guided wave propagation along the wall when the dispersion phenomenon, the stress wave propagation along the tube wall leakage process waveform distortion, so that through the related analysis leak positioning effect is poor. [3] will be introduced to the concept of modal acoustic emission pipeline in the acoustic emission leak positioning, leakage from multiple modal acoustic emission signal to isolate a single mode of signals, leak positioning model was constructed, and the modal dispersion of guided wave appropriate compensation, achieve better location performance. Therefore, in the use of modal acoustic emission pipeline leak detection, need to know in advance the pipe sprocket dispersion characteristics of wave propagation, so that in the process of leak positioning is effective in compensating for guided wave dispersion, and thus achieve the goal of improve the leak positioning accuracy.
Due to its characteristics of acoustic emission source, acoustic emission signal propagation path, a variety of complex factors such as ambient noise and acoustic emission measurement system, the influence of the acoustic emission sensor output waveform is complex, belongs to a kind of non-stationary random signal, which need to use a variety of signal processing technology to effectively extract acoustic emission source of information. The traditional signal analysis methods for the analysis of the acoustic emission signal can't solve the contradiction between time and frequency resolution, and wavelet transform method can be used to solve this problem.
In this paper, through the pipe broken pencil lead, based on the acoustic emission test on the wavelet transform (Gabor wavelet) of the acoustic emission signal processing, F (1, 1) in the pipeline are obtained modal dispersion characteristics of guided waves.
2 the wavelet transform in the application of the modal acoustic emission signal analysis
Wavelet transform is in recent decades developed a kind of signal processing method, and the signal time domain analysis, wavelet transform has in time domain and frequency domain at the same time the ability of denoting local signal characteristics, and can describe a spectrum corresponding time domain information and well handle the relationship between time and frequency resolution, suitable for local analysis of time-varying signals for analysis with the transient phenomena of the acoustic emission signal is particularly suitable for.
Suppose structure along the X direction spread some unit amplitude of acoustic emission signal, two frequency components by w1 and w2 (with minor difference) of a single mode of guided wave, and known the modal guided wave propagation in the structure, or known wave number frequency variation relationship between k (w). Then the acoustic emission signal u (X, t) can be expressed as
Make the following variable substitution:
(1) can be rewritten as
It can be seen that the acoustic emission signal consists of two parts, part index said to want to speed the spread of the Cp = wc/kc carrier; When delta - > 0 k, cos said item to the spread of the group velocity of Cg = dw/dk modulation signal.
Signal analysis for frequency dispersion, Gabor wavelet has better resolution, time domain and frequency domain of the acoustic emission signal u (x, t) small wave Gabor transform:
Type: a scale factor, and a > 0; B it's too shift factor; Angle on the * said complex conjugate.
Gabor wavelet spectrum is RMB $g (t) and g (w)
Type: y and w0 is normal number, order
Will type (3) into the Gabor wavelet transformation type (4), its wavelet transform expressions:
By wavelet transform
Analysis (10), when the 1 / a = wc/w0 = f and b = / delta (delta k w) x = x/Cg, take the maximum type (10). At the frequency f = wc/w0
And the amplitude of the acoustic emission signal wavelet transform time shift of the peak corresponds to b is the modal arrive guided wave sensors. In the case of known the two sensors distance L, can be calculated by type (1) the modal guided wave in the frequency f = wc/w0 group velocity of Cg.
Type, b1 (f), b2 (f) at the frequency f, respectively, the modal guided wave reaches the two sensors.
3 sheet acoustic emission experiment
In the laboratory, the establishment of modal acoustic emission test system in the pipeline. As shown in figure 1. Mainly includes the steel pipe to be detected, acoustic emission sensors, PCI and DSP acoustic emission data acquisition board, preamplifier and filter, etc. To detect the thickness of the steel tube is 6 mm, outside diameter is 159 mm, the lead broken for typical acoustic emission source, by the lead in the steel tube broken acoustic emission test, determine the spread of the steel tube in the main dispersion characteristics of guided wave mode. If the distance between the two acoustic emission sensors known L, on the edge of the steel tube with two acoustic emission sensors in a straight line to the location of the broken lead loaves of bread, will produce more in steel pipe modal acoustic emission signal, which is given priority to with low order modal guided wave bending. Received by acoustic emission sensor signal, after the preamplifier amplification, acoustic emission through four channels data acquisition boards stored in the computer, for further analysis.
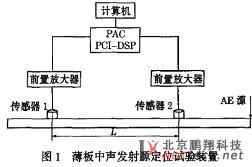
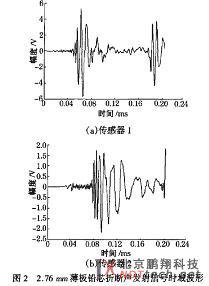
When the two acoustic emission sensor distance L = 115 mm, received the lead broken acoustic emission signal (figure 2) according to type (4) step length is equal to the sampling interval of the delta t score, move when the scale factor a and factor b discretization press type:
Type: m, n is positive integer.
So, to get the amplitude of the acoustic emission signal wavelet transform time-frequency distribution, as shown in figure 3. From the two acoustic emission sensor receives the acoustic emission signal of amplitude and contour map of wavelet transform, it can be seen that broken lead under the Angle, the acoustic emission signal includes a variety of plate wave mode, of which the low-order A0 modal and S0 modal guided wave is given priority to.
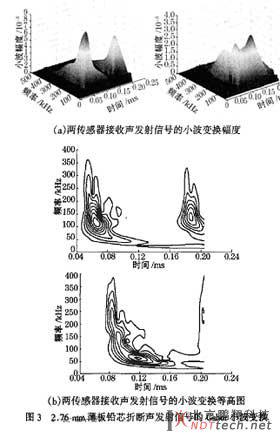
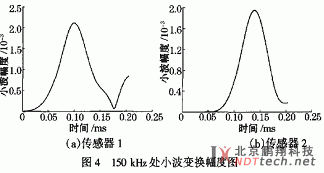
Figure 4 is 60 KHZ lead broken acoustic emission signal under wavelet transform, A0 mode guided wave can be determined to reach two sensors time respectively By type (12) to determine the modal under 60 KHZ guided wave group velocity, and theoretical calculation of the frequency of the modal of guided wave group velocity compared to 2.188 m/ms, the relative error is 4.9%.
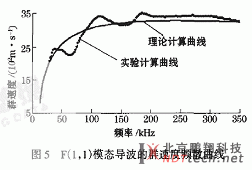
According to different frequency under A0 mode guided wave arrival time difference of two sensor, can calculate the modal of the guided wave group velocity dispersion curve, as shown in figure 5. Among them, the solid line and dotted line respectively test and theoretical calculation of A0 modal dispersion curve, one very good matches. Similarly, you can get S0 modal group velocity dispersion curve of guided wave. As can be seen from the figure 5, within a certain frequency band, is obtained by the lead broken acoustic emission test sheet of A0 and S0 modal dispersion curve of guided wave transmission and accord well with those of theory to calculate the dispersion curve; But in the higher frequency range, test the frequency dispersion curve and theoretical calculation of the difference of dispersion curve. Caused the main reason for the difference is bigger, including modal dispersion of guided wave and echo waveform caused by stacking, etc.
4 conclusion
By the lead broken acoustic emission experiments, using the wavelet transform and the combination of modal analysis method, get a band within 2.76 mm sheet of A0 modal and S0 modal group velocity dispersion curve of guided wave, for ultrasonic testing in the spectrum test provides the necessary guidance.


