Pick to pass to a variety of engineering system of graphite materials acoustic emission behavior research, probes into the characteristics of acoustic emission behavior of graphite materials, found and put forward the number of acoustic emission increases with the load index and graphite materials ae amplitude to obey the rule of exponential distribution, and from the Angle of its microscopic structure acoustic emission behavior explained. On this basis, the correlation with graphite structure and the performance of the acoustic emission behavior conducted a systematic research on quantitative analysis for the first time. The results show that the acoustic emission behavior of graphite and grain size, bending strength and the degree of nonlinear has obvious relevance. Therefore, the application of acoustic emission in the graphite material production detection technology has a certain guiding significance.
keywords Graphite; Acoustic emission; The amplitude distribution; The nonlinear behavior
Acoustic emission is produced materials under stress state of the transient stress wave. The acoustic emission behavior and structure properties have close relations, so acoustic emission has become a characterization of the characteristics of a kind of important means. On the other hand, by means of acoustic emission materials
Behavior and the structure and the performance of the correlation research, for material testing and analysis, quality control and the structural integrity assessment and provides the basis for safety monitoring. Therefore, the study of the acoustic emission behavior have been many materials science and technology work
The importance to it. However, in terms of graphite materials, although there are some research papers published, but have not yet seen a systematic research on the report. Reported in this paper, the author of many kinds of graphite materials acoustic emission behavior of the system research, and on this basis of graphite acoustic emission lines
For the association with the structure, performance analysis of the system.
Experiment 1 overview
Eight kinds of graphite is studied in this experiment, respectively, with the letter A - H said. The graphite respectively applied in aerospace industry, nuclear industry and the electric arc steelmaking industry. All graphite samples are processed into bar, and on the tensile tester, in the form of three point bending load, span and the thickness of the sample ratio is 4:1, load displacement rate is 0.5 mm/min. Acoustic emission monitoring and load simultaneously, acoustic emission detection analysis system and literature of the same.
2 the results and discussion
2.1 the amplitude of acoustic emission distribution
Acoustic emission signal amplitude of the size directly and produce acoustic emission source associated release of energy. As a result, the amplitude of acoustic emission distribution reflects the stress conditions, material in the acoustic emission source intensity of the event. Usually, the cumulative ae amplitude
Cloth can use a experience index relationship between quantitative description:


Among them a - amplitude; A (0) - measurable minimum amplitude, namely, the threshold level of sensors; N - amplitude is greater than or equal to a number of accumulated acoustic emission; N - considering the total number of acoustic emission over a period of time, its size reflects the microscopic dynamics process of materials under stress state activity; B - constant and its size reflects the large amplitude and the small amplitude of acoustic emission number proportion in the total number of acoustic emission. (1), N, b is the amount of two related to material characteristics. The amplitude ratio a/a (0) expressed in the dB, then the amplitude range interval is divided into a number of channels, such as type (1) can be expressed as


R - associated with b and channel division of constant, accordingly can indeed type (1) the amplitude distribution parameter b; C, and b values and acoustic emission total amount about the N; T - channel number, T is a value with a certain amplitude range corresponding to the value of integer greater than or equal to zero, typically in order of amplitude of growing up.
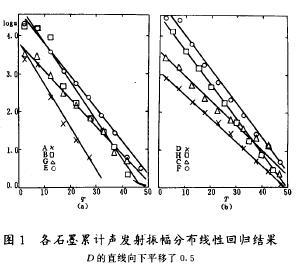
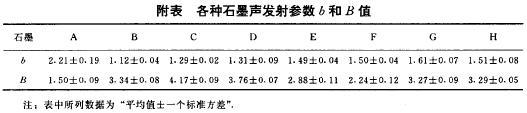
Figure 1 for eight kinds of graphite are studied in this experiment to the fracture of the cumulative ae amplitude distribution according to the type (2) the results of linear regression, the corresponding values listed in schedule b, thus it can be seen: (a) for all of graphite, the amplitude of acoustic emission distribution can well follow the type shown in (1) the index law, show that in the acoustic emission of graphite outsiders to release energy in the majority; (b) for some graphite until the sample fracture will not appear larger amplitude of acoustic emission, such as graphite, A; While some graphite, such as graphite, F are produced in the process of loading the large amplitude of acoustic emission, illustrate different graphite materials, its ability to store strain energy has bigger difference.
Experimental results also show that: (a) when the load added to any value of the total number of acoustic emission can well follow the type shown in (1) the index law of amplitude distribution parameter b and along with the change of load is different; (b) is similar to cumulative ae amplitude distribution, acoustic emission number itself also obey the index distribution.

2.2 acoustic emission behavior and the relationship between load
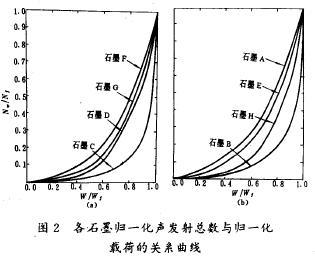
All kinds of graphite when the load is added to the total number of acoustic emission when W and Nw until fracture of the acoustic emission ratio of the total number of Nf Nw/Nf (called normalized total acoustic emission) and breaking load and load W Wf ratio of W/Wf (called normalized load) relationship curve is shown in figure 2. Visible, most of the graphite in the load is small number of acoustic emission and rarely increases slowly; Load continues to increase, the number of acoustic emission is increased dramatically.
Quantitative analysis shows that, for all kinds of graphite, the normalized total number of acoustic emission and normalized load following these index well relationship between:

Type of the parameter B is associated with material, its size according to the total number of acoustic emission with the increase of load speed. All kinds of graphite B value as shown in table 1.
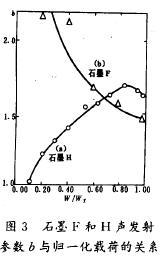
Ae amplitude distribution parameter b along with the change of load, there are two kinds of different situations, respectively, as shown in figure 3 curves shown in (a) and (b). Which curve (a) for graphite H parameter b and the curve of load. Visible, the graphite H, b increases with the increase of load, until close to breaking load (W = 0.85 Wf) b take maximum, then b decreases. This relationship: when the load is not too big, graphite occurring within the nonlinear dynamic process with less energy released events, such as grain size of cleavage is given priority to; When the load is close to breaking load, energy is released more events, such as through the orientation of crack and fracture into larger Angle increases quickly and the proportion of grain extension. The behavior of graphite H literature from its loading process in different phase on the mechanism of the propagation of crack has made the detailed explanation and demonstration.


As shown in figure 3 curve (b) for graphite F parameter b's relationship with load. Graphite F parameter b falling along with the load behavior and graphite H there is a big discrepancy, the reason may be that graphite grain smaller and more uniform F (d = 1.30 + / - 0.1 mm), and graphite crystal of H
Grain is bigger and discrete also big (d = 2.0 + / - 0.3 mm). Graphite F this kind of uniform structure and grain size smaller and less grain preferred orientation, makes the load gradually increases produce the large amplitude of the acoustic emission also gradually increased, leading to b value became smaller.

2.3 acoustic emission behavior and the relationship between grain size
Graphite acoustic emission parameter b, Nf relations along with the change of grain size has indicated in figure 4, in which (a) until the total number of acoustic emission at fracture of Nf natural logarithm relationship with the grain size d, regression analysis showed that the Nf the correlation between d and is very significant, regression equation for


Where d is an unit with mm. Visible, acoustic emission index increased with the increase of grain size of the total. Figure 4 (b) for the parameter b of logarithmic logb with logd diagram. Regression analysis shows that the d and b to return to the agenda


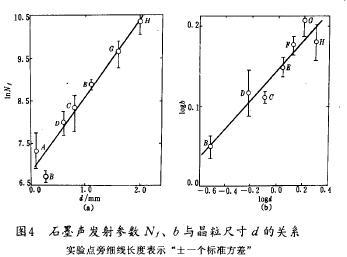

Visible, acoustic emission behavior of graphite materials there is significant correlation with grain size, grain size is coarse graphite load will produce a large number of acoustic emission, and the proportion of small amplitude of acoustic emission is bigger; And fine grain graphite make a sound emission is less, and the proportion of small amplitude of acoustic emission is smaller.
Graphite materials, acoustic emission behavior and the relation between aggregate particles size can be obtained by studying the effect of particle size on the structure and interpretation. Because of acoustic emission signal amplitude and event release of energy source, the graphite material, small amplitude of acoustic emission
Usually less micro kinetics process and release energy, such as grain size of dislocation, cleavage, etc. Graphite of aggregate particles coarser, due to its structure is relatively loose, loading material unable to store more energy, in the so in the process of loading
Materials through the formation and expansion of a large number of micro cracks and constantly release energy, which is lead to the coarse grain graphite loading process of acoustic emission, and small amplitude of acoustic emission signal than major.
On the contrary, to fine grain graphite material, because its structure is compact, material can be stored in the larger energy; At the same time, because in the process of manufacturing for small particles caused by the working procedure such as particle crushing reduce crack is formed on the particle and crystal
Grain of cleavage, etc. The possibility of the dynamical process of smaller energy released, therefore in the loading process of acoustic emission is less, and small amplitude of acoustic emission signals proportion is larger than the coarse grain graphite.
2.4 acoustic emission behavior and flexural strength of the relationship
The strength of materials is one of the important parameters of the material. This test in monitoring acoustic emission and strength of graphite was determined. Acoustic emission parameters of Nf and b and flexural strength of the delta between correlation regression results as shown in figure 5. Figure 5 (a) to 1 NNF and the delta of the regression results, figure 5 (b) the regression results for b and the delta. Nf and the regression equation between the delta


Delta of the unit for the MPa. (6) shows that the total number of acoustic emission index decreased with the increase of the intensity of graphite. As shown in figure 5 (b) straight line for the corresponding regression equation


Delta of the unit for the MPa. Visible, b linear decrease with the increase of the intensity of graphite.
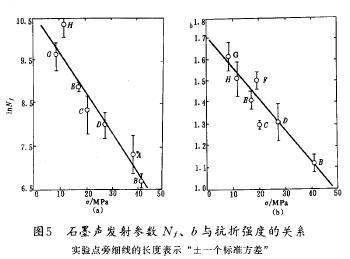

Graphite acoustic emission behavior and, therefore, there is also a significant correlation between flexural strength, flexural strength of graphite will produce fewer acoustic emission, and the small amplitude of acoustic emission for a small proportion; The flexural strength more small graphite produced by acoustic emission
And small amplitude of acoustic emission for a larger proportion.
As known, the flexural strength of graphite materials and has a close relationship between total porosity, its total porosity, the greater the intensity, the smaller. Flexural strength of graphite, therefore, its structure is compact, uniform, accordingly including the size of the hole or crack
Also small. For such as graphite, which can store more elastic strain energy. Somewhere once the strain energy above a certain critical value, the stress intensity exceed the critical stress intensity factor, then the cracks will rapidly expand, until the fracture, the approximate brittle broken
Crack due to the release of energy is relatively concentrated, the process of the amplitude of acoustic emission in the proportion of very small breasts is small, thus make the whole process of acoustic emission is less, and the value of the amplitude distribution parameter b is small. Small folding strength graphite material, by
In which the size of the hole or crack is bigger, in the process of loading materials often and cannot store large strain energy, but when the strain energy more than the smaller value is released in the form of acoustic emission, making the vast majority are small amplitude of acoustic emission.
Only when the load is close to breaking load, the considerable large amplitude acoustic emission is produced. As a result, they produced in the process of loading on the number of acoustic emission, and small amplitude of acoustic emission for a larger proportion, and b value is bigger.
2.5 acoustic emission behavior and the degree of nonlinear relationship
Materials acoustic emission is in the process of loading and material nonlinear dynamic process in closely related. Thus, the acoustic emission behavior and there must be a relationship between the degree of nonlinear.
Graphite material deviation degree can be used for the linear behavior of nonlinear parameter k quantitative description, and the greater the k value, the higher the degree of nonlinear of graphite.
Several kinds of graphite acoustic emission parameter Nf, the relationship between b and nonlinear parameter k is shown in figure 6. Figure 6 (a) said logNf relation with k, for the corresponding regression equation


Shows that graphite acoustic emission index increased with the increase of the degree of nonlinear total. Figure 6 (b) amplitude distribution parameter b and k, the relationship between figure in a straight line for the corresponding regression equation


Show parameter b increases linearly with the increase of k.
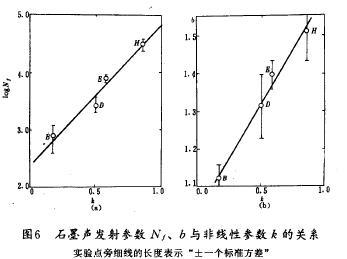

Type (8) and (9) as shown in the relationship between correlation is significant. Graphite acoustic emission behavior and, therefore, there is also a significant correlation between degree of nonlinear: the higher the degree of nonlinear of graphite, is the more the number of load when the acoustic emission, and the greater the proportion of small amplitude of acoustic emission.
3 conclusion
A. graphite materials ae amplitude distribution to obey a experience index law, namely the graphite in the acoustic emission with small amplitude of acoustic emission dominate;
B. the total number of acoustic emission sharply increased with the increase of the load, the relationship can be quantitative description with an exponential law. Along with the change of load amplitude distribution parameter b reflect the formation of cracks in the different phase, the law varies with the different of graphite materials
Different;
C. graphite materials acoustic emission behavior there is significant correlation with grain size, the larger the grain size, the more produced by acoustic emission, and the greater the proportion of small amplitude of acoustic emission.
D. graphite materials plays a significant role in acoustic emission behavior and flexural strength of dependencies: flexural strength, the greater the number of acoustic emission which is less, and the smaller the proportion of small amplitude acoustic emission;
E. graphite material nonlinear behavior has obvious effects on the acoustic emission: the higher the degree of nonlinear, the more number of acoustic emission, and the greater the proportion of small amplitude of acoustic emission.
References (abbreviated)


 Blog
Blog